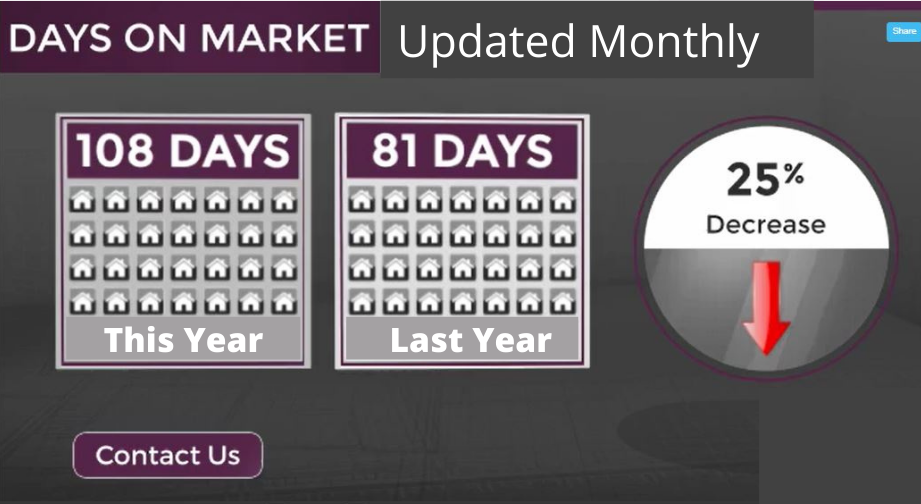
Berkshire Hathaway HomeServices Hilton Head Bluffton Realty is pleased to offer these professional and dynamic 60-second market updates for our clients.  The videos touch on 5 key components of market activity:  Active Inventory, Median Listing Price, Days on the Market, Median Sales Price, Units Sold.   Open the Full post to click Video Links.

Video Market Updates

  1. Sea Pines
  2. Palmetto Dunes & Shelter Cove 
  3. Forest Beach
  4. Shipyard 
  5. Folly Field, Hilton Head          
  6. Hilton Head Plantation
  7. Windmill Harbour
  8. Long Cove 
  9. Hilton Head Condos ($250K+)
  10. Hilton Head Luxury Homes          
  11. Bluffton   
  12. Oldfield 
  13. Sun City
  14. Latitude Margaritaville           
  15. Bluffton Luxury Homes   

Our goal with these fact-based videos is to…

4156 Views, 0 Comments

January 2020 Market Overview - Hilton Head and Bluffton

As the cost of renting continues to increase, consumers have more incentive to lock in their housing costs by purchasing a home. The latest CoreLogic Single-Family Rent Index report released this month saw the cost of renting single-family homes, including condos, up 3% in November 2019 versus November 2018. According to CoreLogic’s data, single-family rents started climbing in 2010 and have stabilized around an annualized rate of 3% since early 2019. For the 12-month period spanning February 2019 through January 2020, Pending Sales in the Hilton Head region were up 8.7 percent overall. The price range with the largest gain in sales was the $650,001 and Above range, where they increased 17.4 percent.

The overall Median Sales Price was up 3.5…

770 Views, 0 Comments

The 2019 housing market was fueled by the overall strength of the economy across most of the country. The stock markets reached new highs throughout the year, improving the asset bases of millions of Americans. Unemployment rates fell to 50-year lows, while wages increased, creating new home buyers. Mortgage rates also declined significantly from 2018, helping to offset affordability stresses caused by continued price appreciation nationally.  ***More Info below Graph***2019 Annual Report

With a strong economy and low mortgage rates, buyer activity has been strong. However, most markets are being constrained by inventory levels that are still below historical norms. With supply and demand continuing to favor sellers, prices continue to rise.

With 10 years having now…

991 Views, 0 Comments

Nov 2019 Market Reports
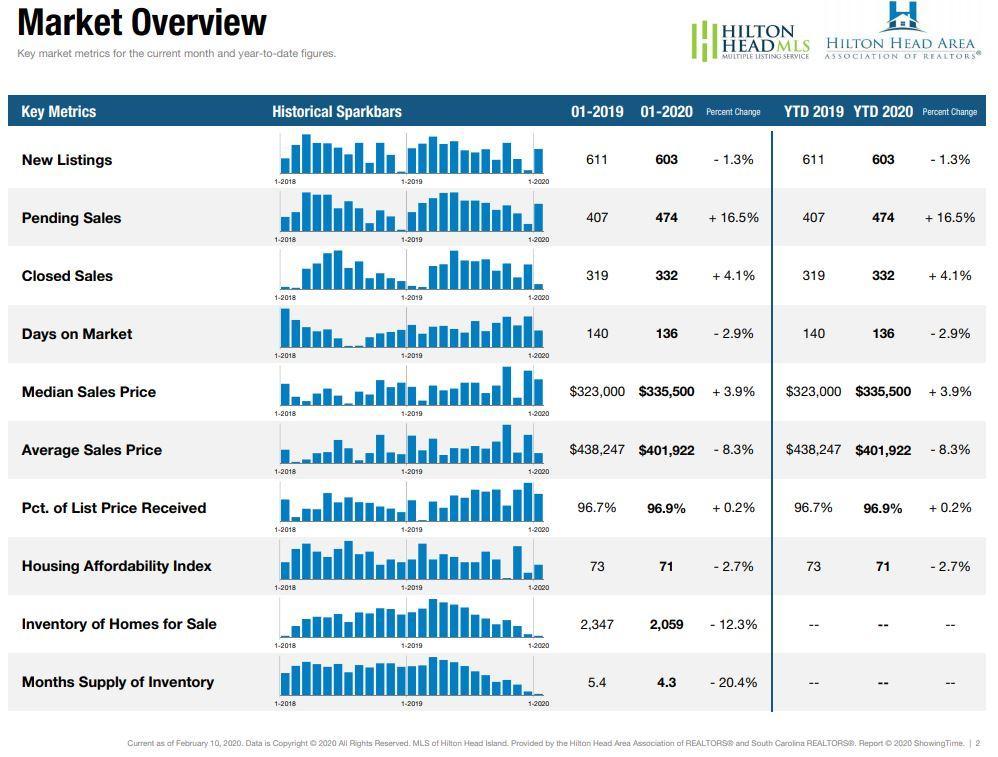
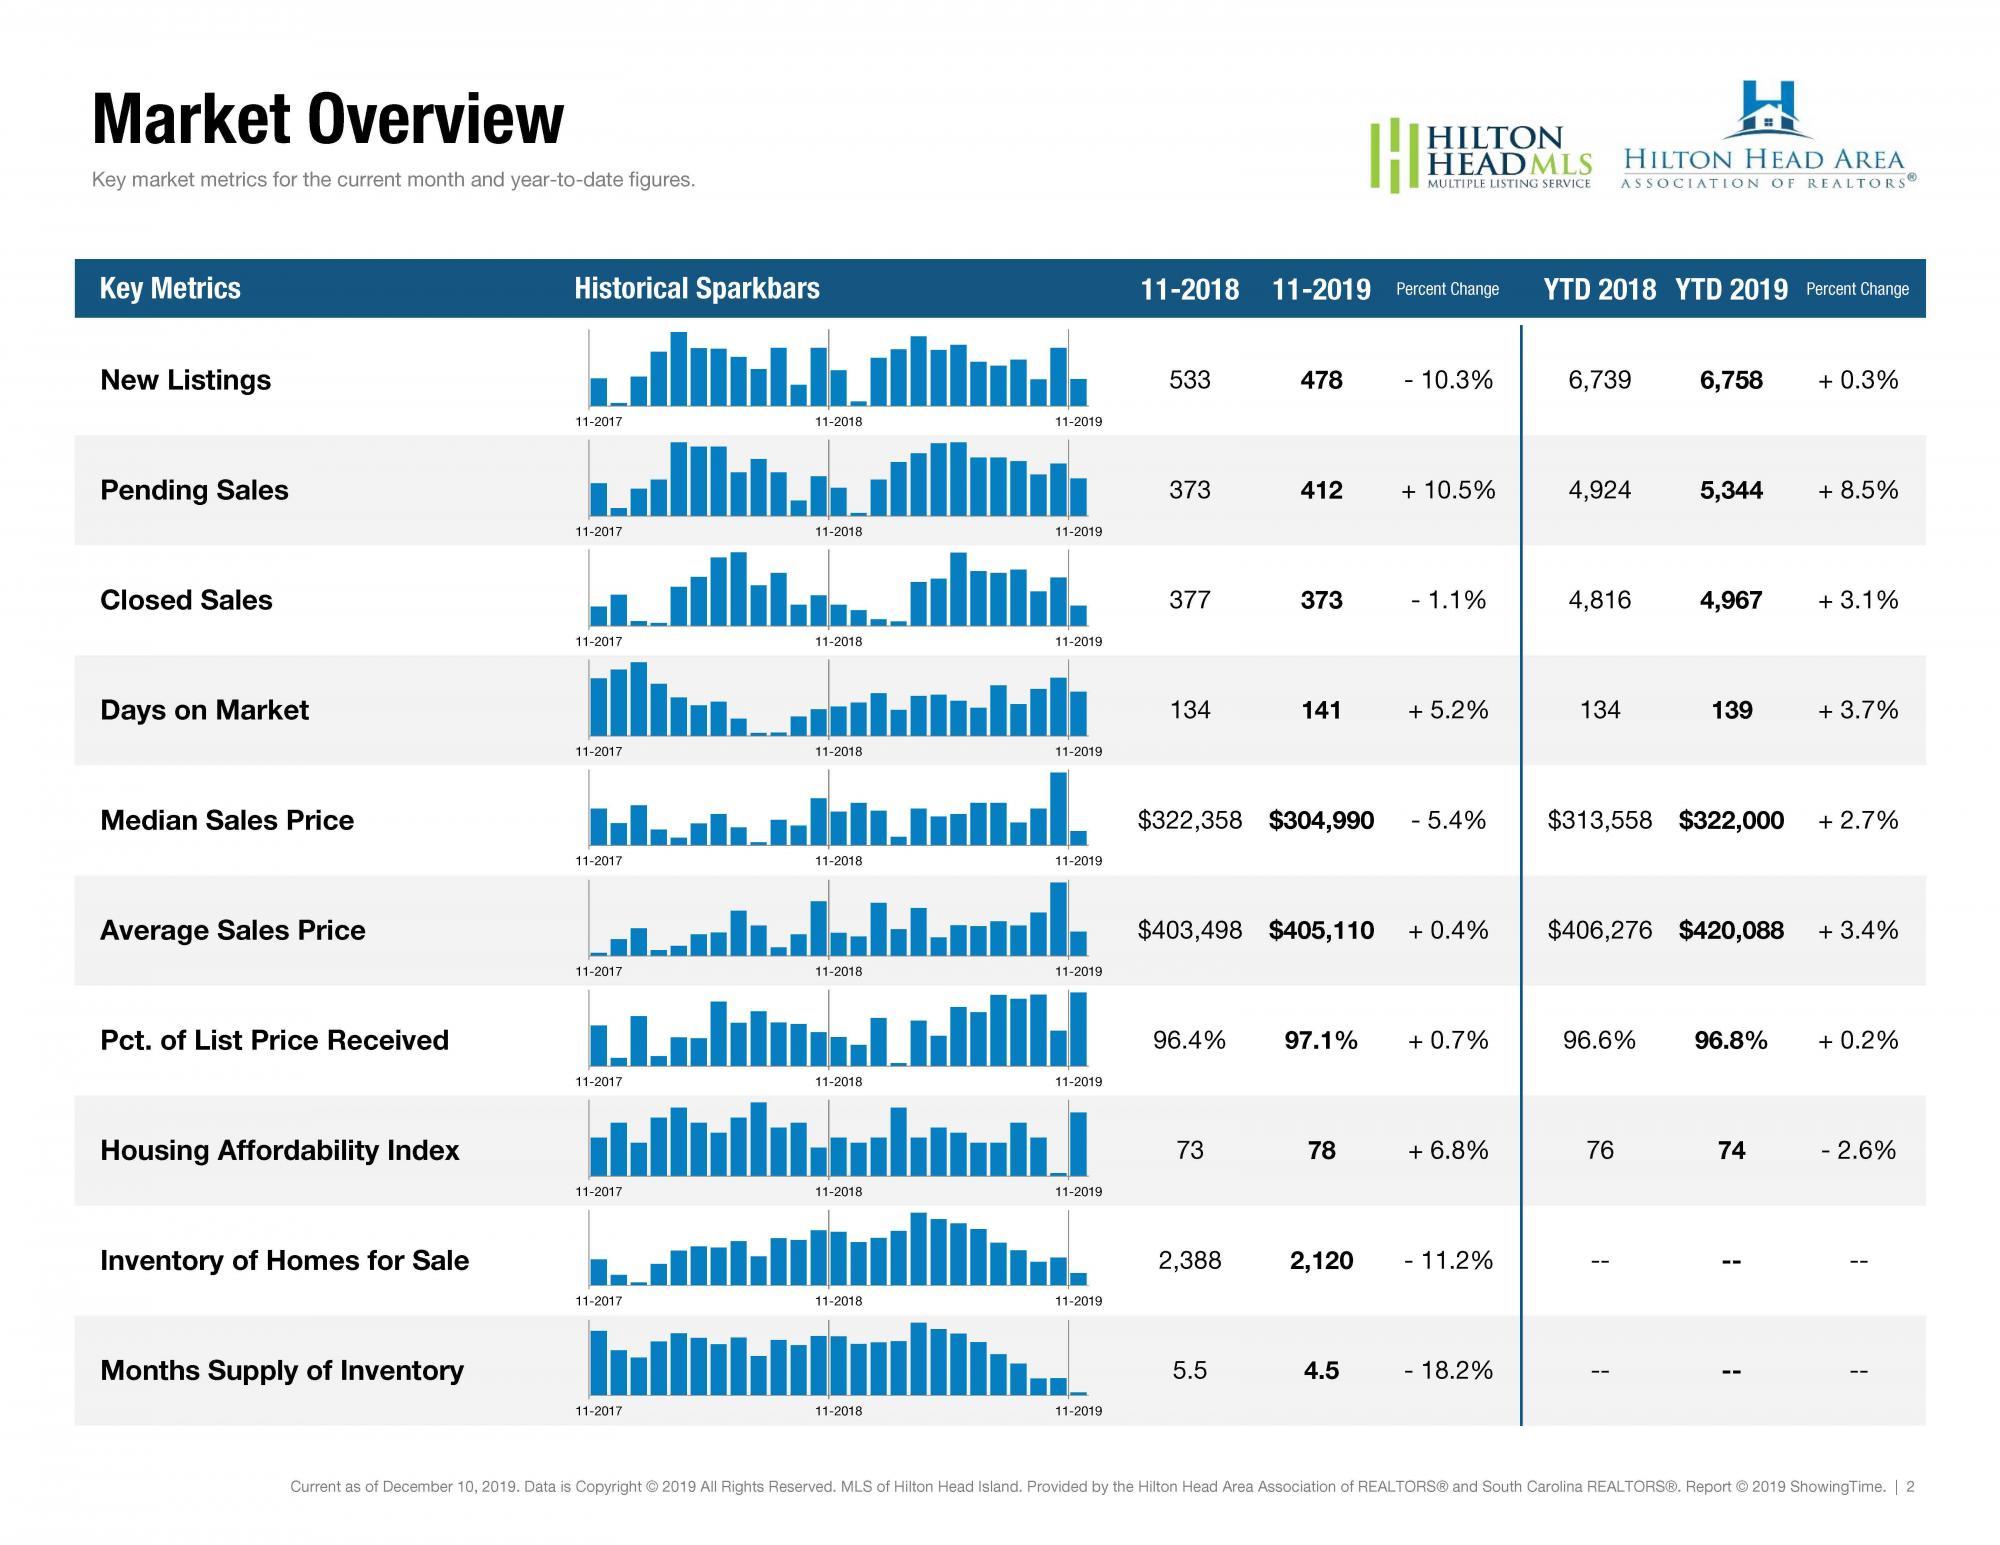
In November, the Federal Reserve reduced its benchmark rate for the third time this year. This action was widely anticipated by the market. Mortgage rates have remained steady this month and are still down more than 1 percent from last year at this time. Residential new construction activity continues to rise nationally. The U.S. Commerce Department reports that new housing permits rose 5% in October to a new 12-year high of 1.46 million units.

New Listings were down 10.3 percent to 478. Pending Sales increased 10.5 percent to 412. Inventory shrank 11.2 percent to 2,120 units.

Prices moved lower as Median Sales Price was down 5.4 percent to $304,990. Days on Market increased 5.2 percent to 141 days. Months Supply of Inventory was down 18.2 percent…

898 Views, 0 Comments

In October, mortgage rates increased slightly from the three-year lows seen in September. While the Federal Reserve reduced the federal-funds target rate by .25%, this decline was widely expected and largely factored into mortgage rates already, which are still approximately 1% lower than this time last year. Fannie Mae is predicting that continued low rates, and possibly lower rates, are expected in 2020.

New Listings were down 0.1 percent to 673. Pending Sales increased 18.2 percent to 500. Inventory shrank 9.6 percent to 2,166 units.

Prices moved higher as Median Sales Price was up 4.9 percent to $350,270. Days on Market increased 10.5 percent to 147 days. Months Supply of Inventory was down 16.4 percent to 4.6 months, indicating that demand…

871 Views, 0 Comments

September 2019 Market Overview

With the kids back in school and the weather cooling, the housing market begins its annual cooldown as well. Nationally, buyer and seller activity remained strong, buoyed by low mortgage rates and a strong economy. The market fundamentals suggest no significant changes from recent trends, other than the seasonally tempered pace we see this time of year. As we move into the final three months of 2019, buyers will find fewer homes coming on the market, but also less competition for those homes.

New Listings were up 7.9 percent to 476. Pending Sales increased 41.8 percent to 451. Inventory shrank 8.6 percent to 2,133 units.

Prices moved higher as Median Sales Price was up 4.8 percent to $325,000. Days on Market increased 8.5 percent to 141 days.…

731 Views, 0 Comments

August 2019 Hilton Head Area Market Indicator
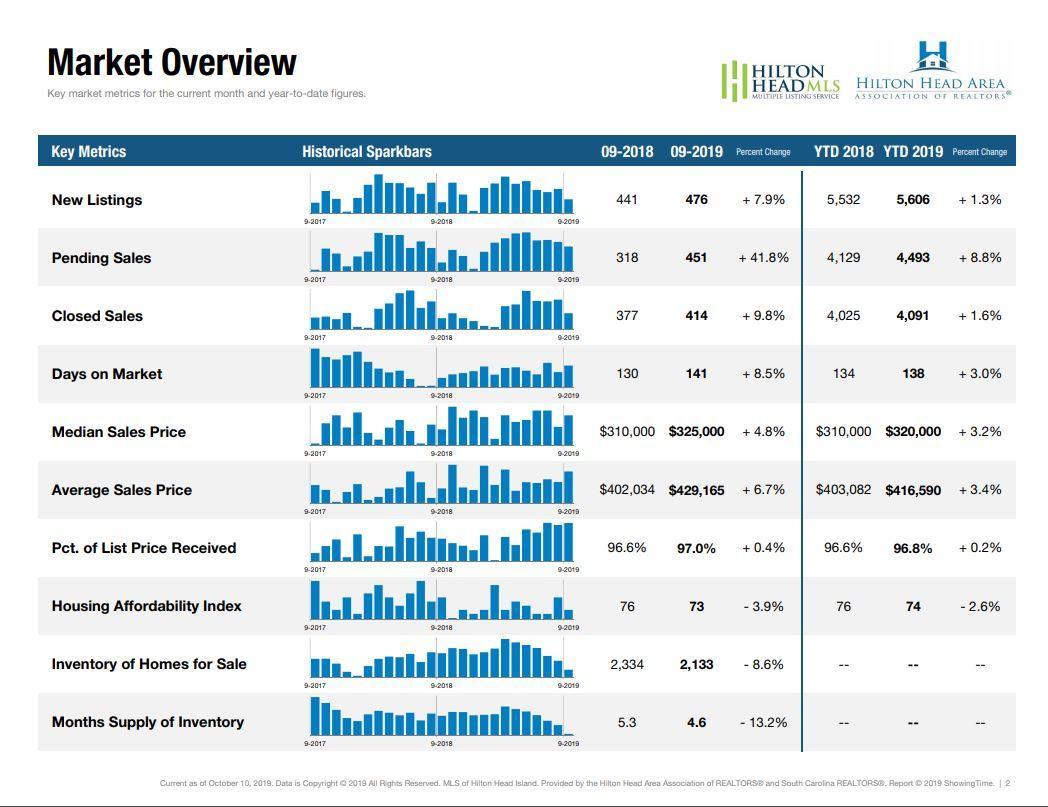
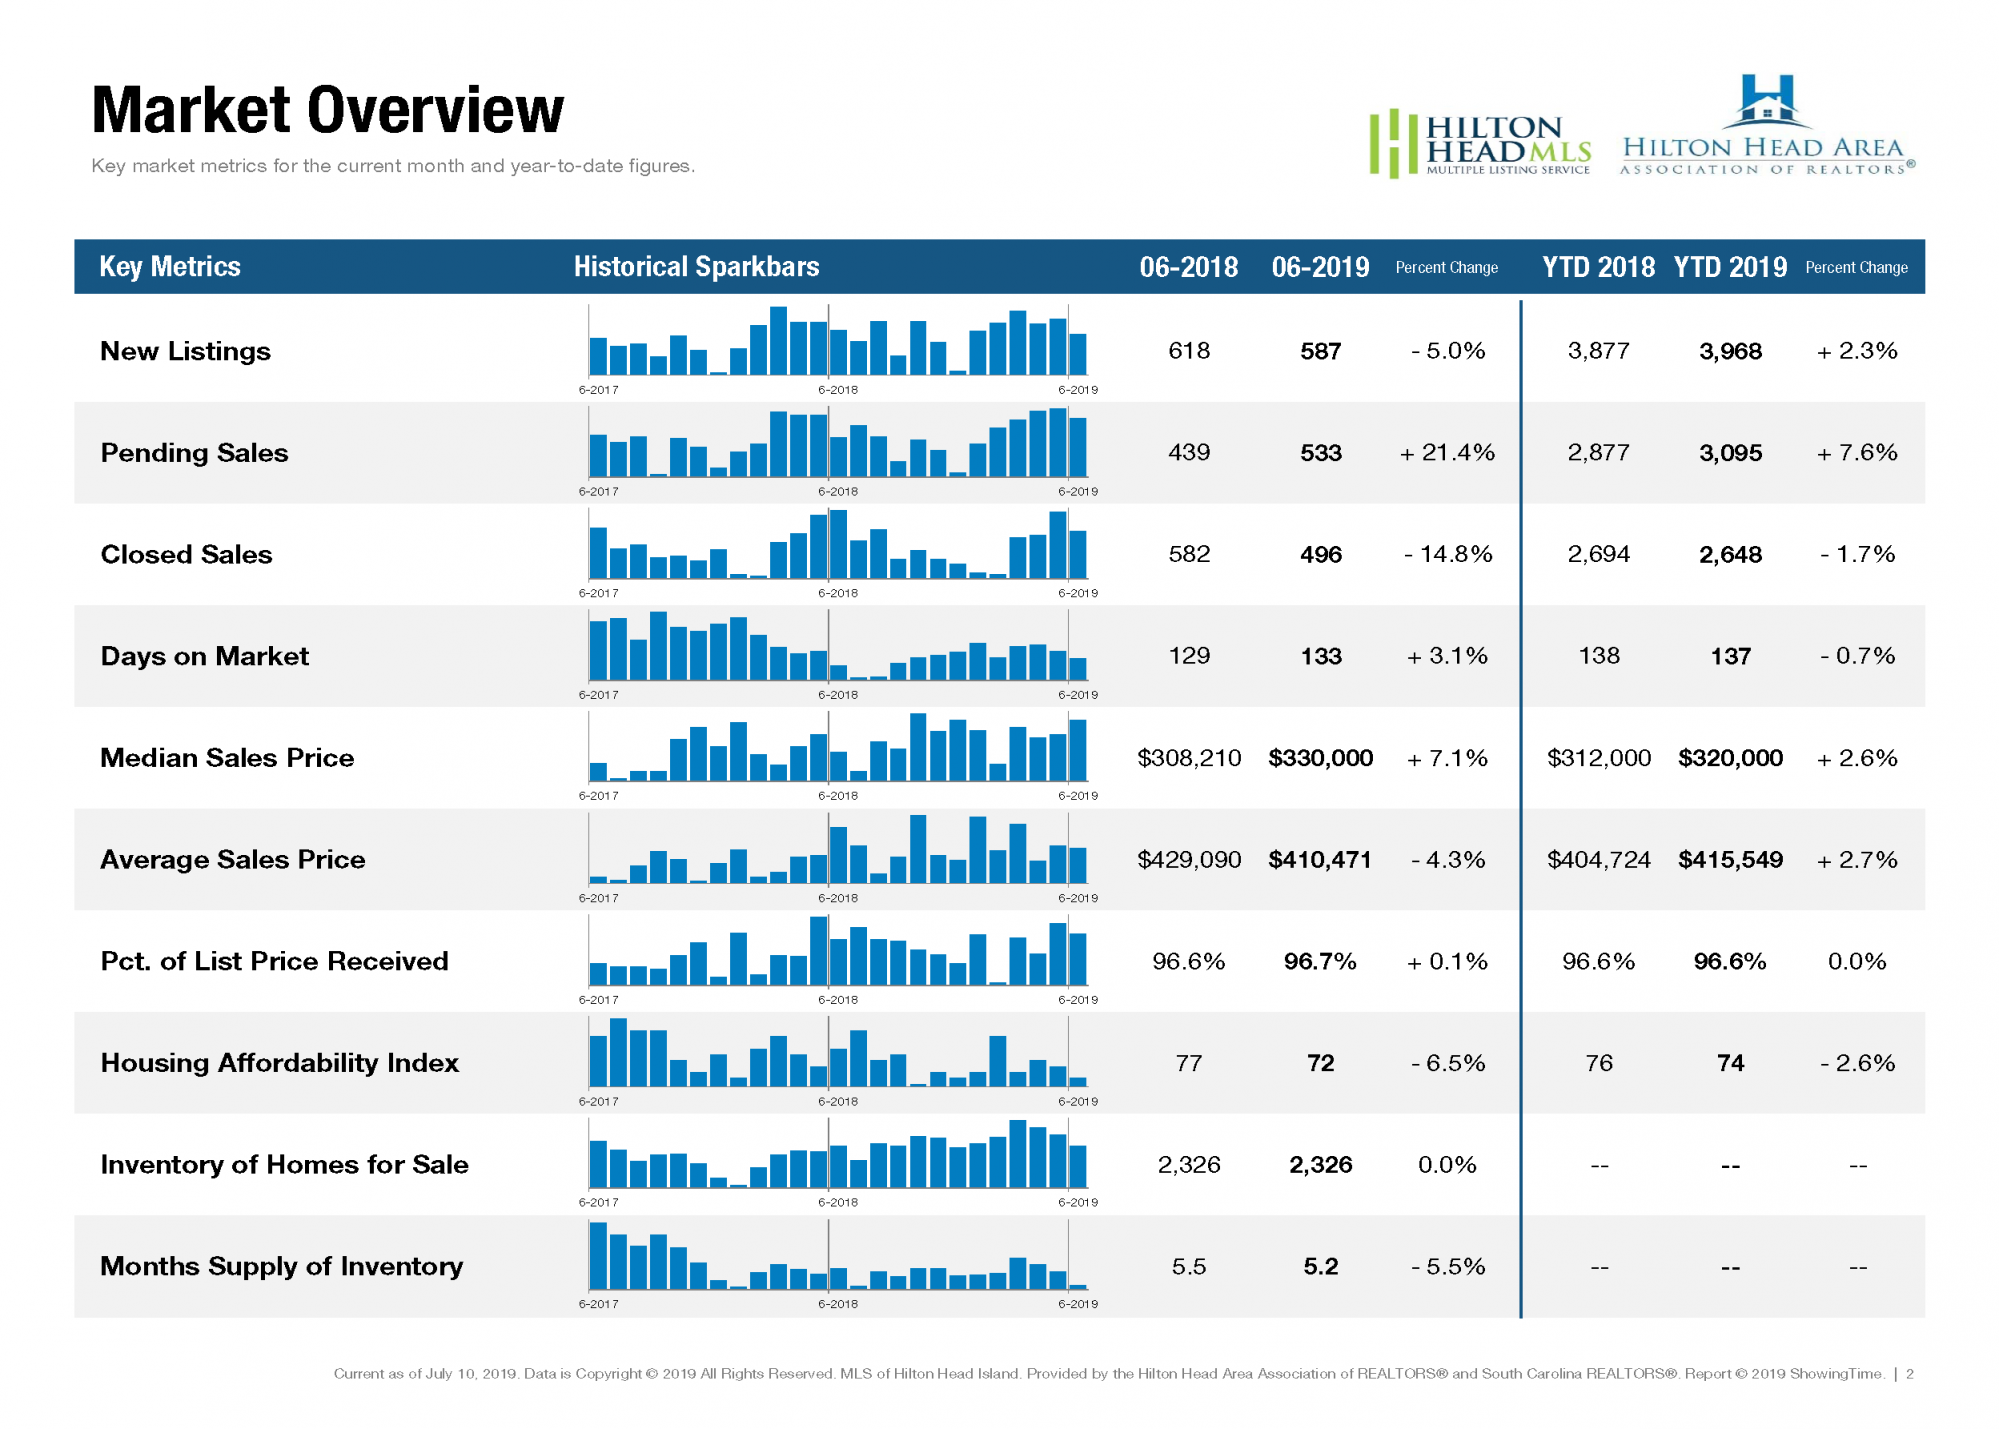
As the summer draws to a close, multiple opposing factors and trends are competing to define the direction of the real estate market. After the Federal Reserve lowered its benchmark interest rate on July 31, 30-year mortgage rates continued to decline, approaching all-time lows last seen in 2016. Yet most experts agree these reductions are unlikely to bring sufficient relief, at least in the short term, for first-time home buyers. The lack of affordable inventory and the persistence of historically high housing prices continue to affect the housing market, leading to lower-than-expected existing home sales at the national level.

New Listings were down 11.0 percent to 600. Pending Sales increased 16.2 percent to 510. Inventory shrank 6.5 percent to…

709 Views, 0 Comments

July 2019 market Reports

In July, the U.S. economic expansion that began in June 2009 became the longest in the nation's history, marking 121 straight months of gross domestic product growth and surpassing the 120-month expansion from 1991 to 2001. The average rate of growth during this expansion has been a milder 2.3 percent per year compared to 3.6 percent during the 1990s. Although the economy should continue to perform well for the rest of 2019, most economists see a mild recession on the horizon.

New Listings were up 3.9 percent to 561. Pending Sales increased 8.3 percent to 536. Inventory grew 0.4 percent to 2,237 units.  Prices moved higher as Median Sales Price was up 11.9 percent to $330,000. Dayson Market increased 16.3 percent to 143 days. Months Supply of…

784 Views, 0 Comments

June 2019 Market Reports

As was widely expected, the Federal Reserve did not change the target range for the federal funds rate – currently set at 2.25 to 2.5 percent – during their June meeting. Although the economy is still performing well due to factors such as low unemployment and solid retail sales, uncertainty remains regarding trade tensions, slowed manufacturing and meek business investments.

New Listings were down 5.0 percent to 587. Pending Sales increased 21.4 percent to 533. Inventory remained flat at 2,326. Prices moved higher as Median Sales Price was up 7.1 percent to $330,000. Days on Market increased 3.1 percent to 133 days. Months Supply of Inventory was down 5.5 percent to 5.2 months, indicating that demand increased relative to supply.

In terms of…

734 Views, 0 Comments

May 2019 Market Reports

At this point in the year, we are getting a good sense for how the housing market is likely to perform for the foreseeable future. And although it is not a particularly exciting forecast, it is a desirable one. Markets across the country are regulating toward a middle ground between buyers and sellers. While it remains true that sales prices are running higher and that inventory options are relatively low, buyers are beginning to find wiggle room at some price points and geographies.

New Listings were up 3.7 percent to 694. Pending Sales increased 9.7 percent to 601. Inventory grew 3.4 percent to 2,363 units.

Prices moved higher as Median Sales Price was up 0.5 percent to $321,500. Days on Market held steady at 136. Months Supply of Inventory…

655 Views, 0 Comments